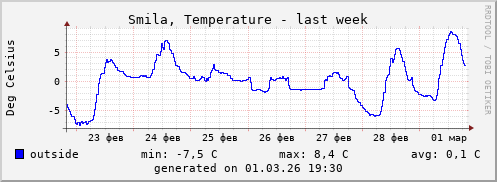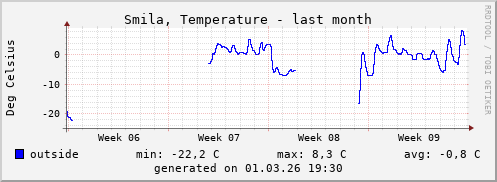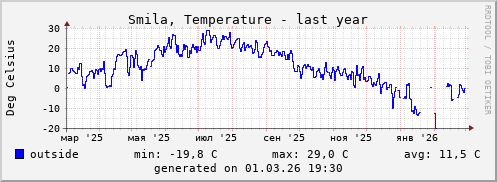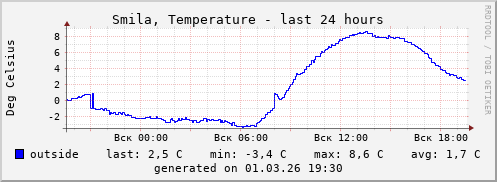
I continuously monitor temperatures in Smila. These charts are updated every 10 minutes. Please note that the summaries for each graph differs because the data is consolidated before the graphs are generated. The 24-hour graph shows the most recent readings.